What Is the Doji Inside Strategy?
The Doji Inside Strategy is a price action setup designed to identify moments of temporary equilibrium that often precede directional movement.
The concept is simple: after a strong directional session, the market pauses. Instead of immediately reversing, price forms a small indecision candle, a Doji, entirely contained within the range of the previous day’s candle.
This creates a compression pattern where volatility contracts and market participants temporarily agree on value.
The strategy focuses on what happens next.
Rather than predicting direction, traders wait for price to break out of the compression and follow the path suggested by the original impulse.
This setup can be found in:
- Swing trading on daily charts
- Trend continuation environments
- Stocks reacting to news or earnings
- Momentum-driven sectors
- Index and ETF trading
The appeal of the setup comes from its simplicity: one strong move, one pause, one decision point.
Key Elements of the Strategy
1. Identify a Strong Reference Candle
The pattern starts with a meaningful directional candle.
For bullish setups, this is typically a strong green candle showing clear buying pressure.
For bearish setups, the opposite applies.
The reference candle establishes the direction that the market was favoring before the pause occurred.
2. Find a Doji Inside the Previous Range
The following session must form a Doji or near-Doji candle.
More importantly:
- The entire candle should remain inside the high and low of the previous day.
- The body should be relatively small.
- Price should show hesitation rather than continuation.
This creates what many traders view as a temporary balance between buyers and sellers.
Volatility contracts.
Attention builds.
3. Wait for the Breakout
The strategy does not assume direction automatically.
Instead, traders wait for price to break beyond the Doji range.
For a bullish setup:
- The reference candle is bullish.
- Price breaks above the Doji high.
For a bearish setup:
- The reference candle is bearish.
- Price breaks below the Doji low.
The breakout acts as confirmation that the market has chosen a side after the period of indecision.
4. Risk Management
Many traders define risk using the opposite side of the Doji.
Bullish example:
- Entry above the Doji high.
- Risk defined below the Doji low.
Bearish example:
- Entry below the Doji low.
- Risk defined above the Doji high.
This creates a clearly defined structure that can be evaluated before the trade develops.
Entry, Risk and Management Rules
| Element | Bullish Setup |
|---|---|
| Entry | Break above the Doji high |
| Risk Reference | Below the Doji low |
| Context | Strong bullish reference candle |
| Goal | Participation in a potential continuation move |
For bearish setups, simply reverse the logic.
The focus is not on forecasting a target, but on identifying situations where a compressed market may be preparing for expansion.
Chart Example
Imagine a stock rallies strongly on Monday and closes near its highs.
On Tuesday, the stock trades quietly and forms a Doji completely inside Monday’s range.
Nothing appears exciting.
No breakout.
No new high.
Just compression.
Then Wednesday arrives and price breaks above the Doji high.
What looked like inactivity suddenly becomes a decision point.
Many momentum traders monitor these types of structures because periods of contraction often precede periods of expansion.
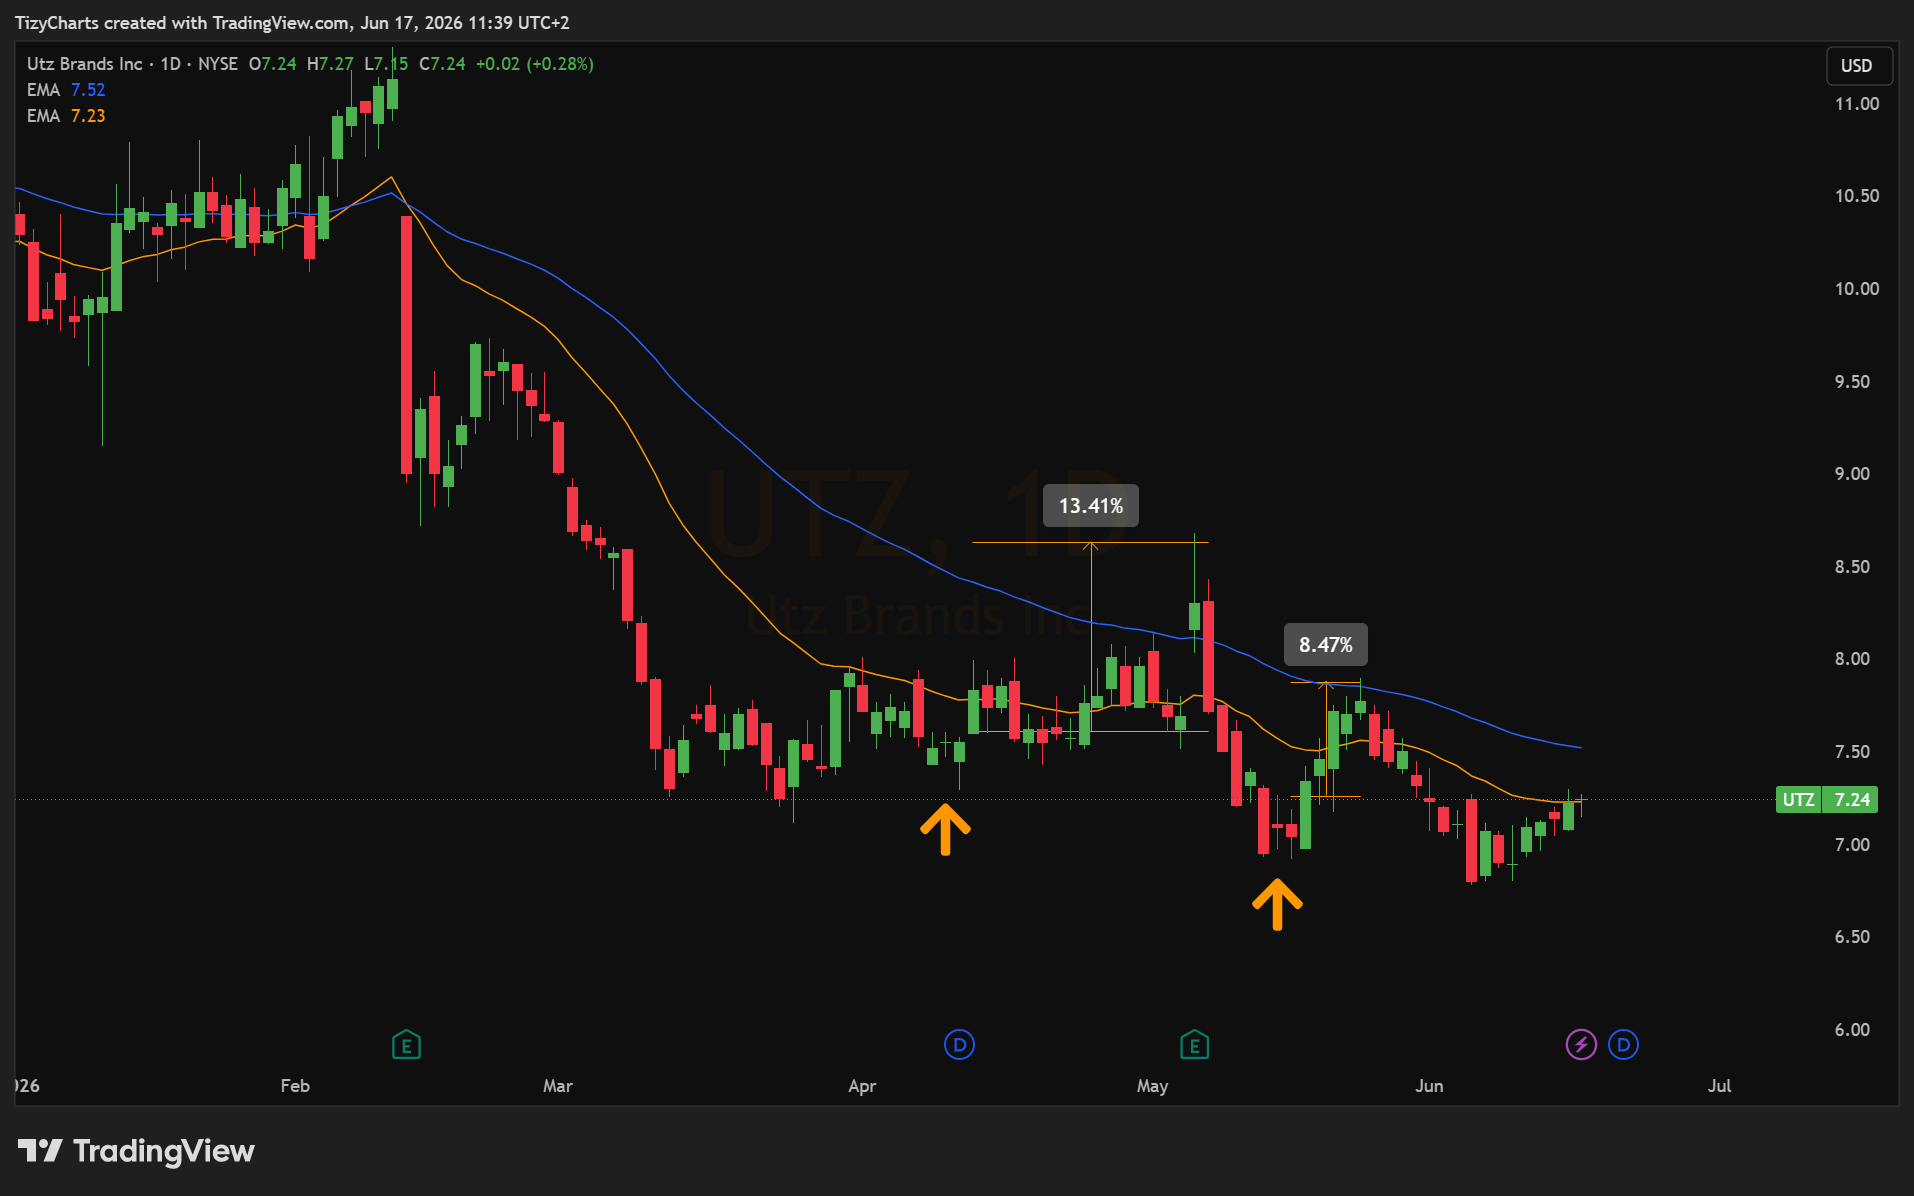
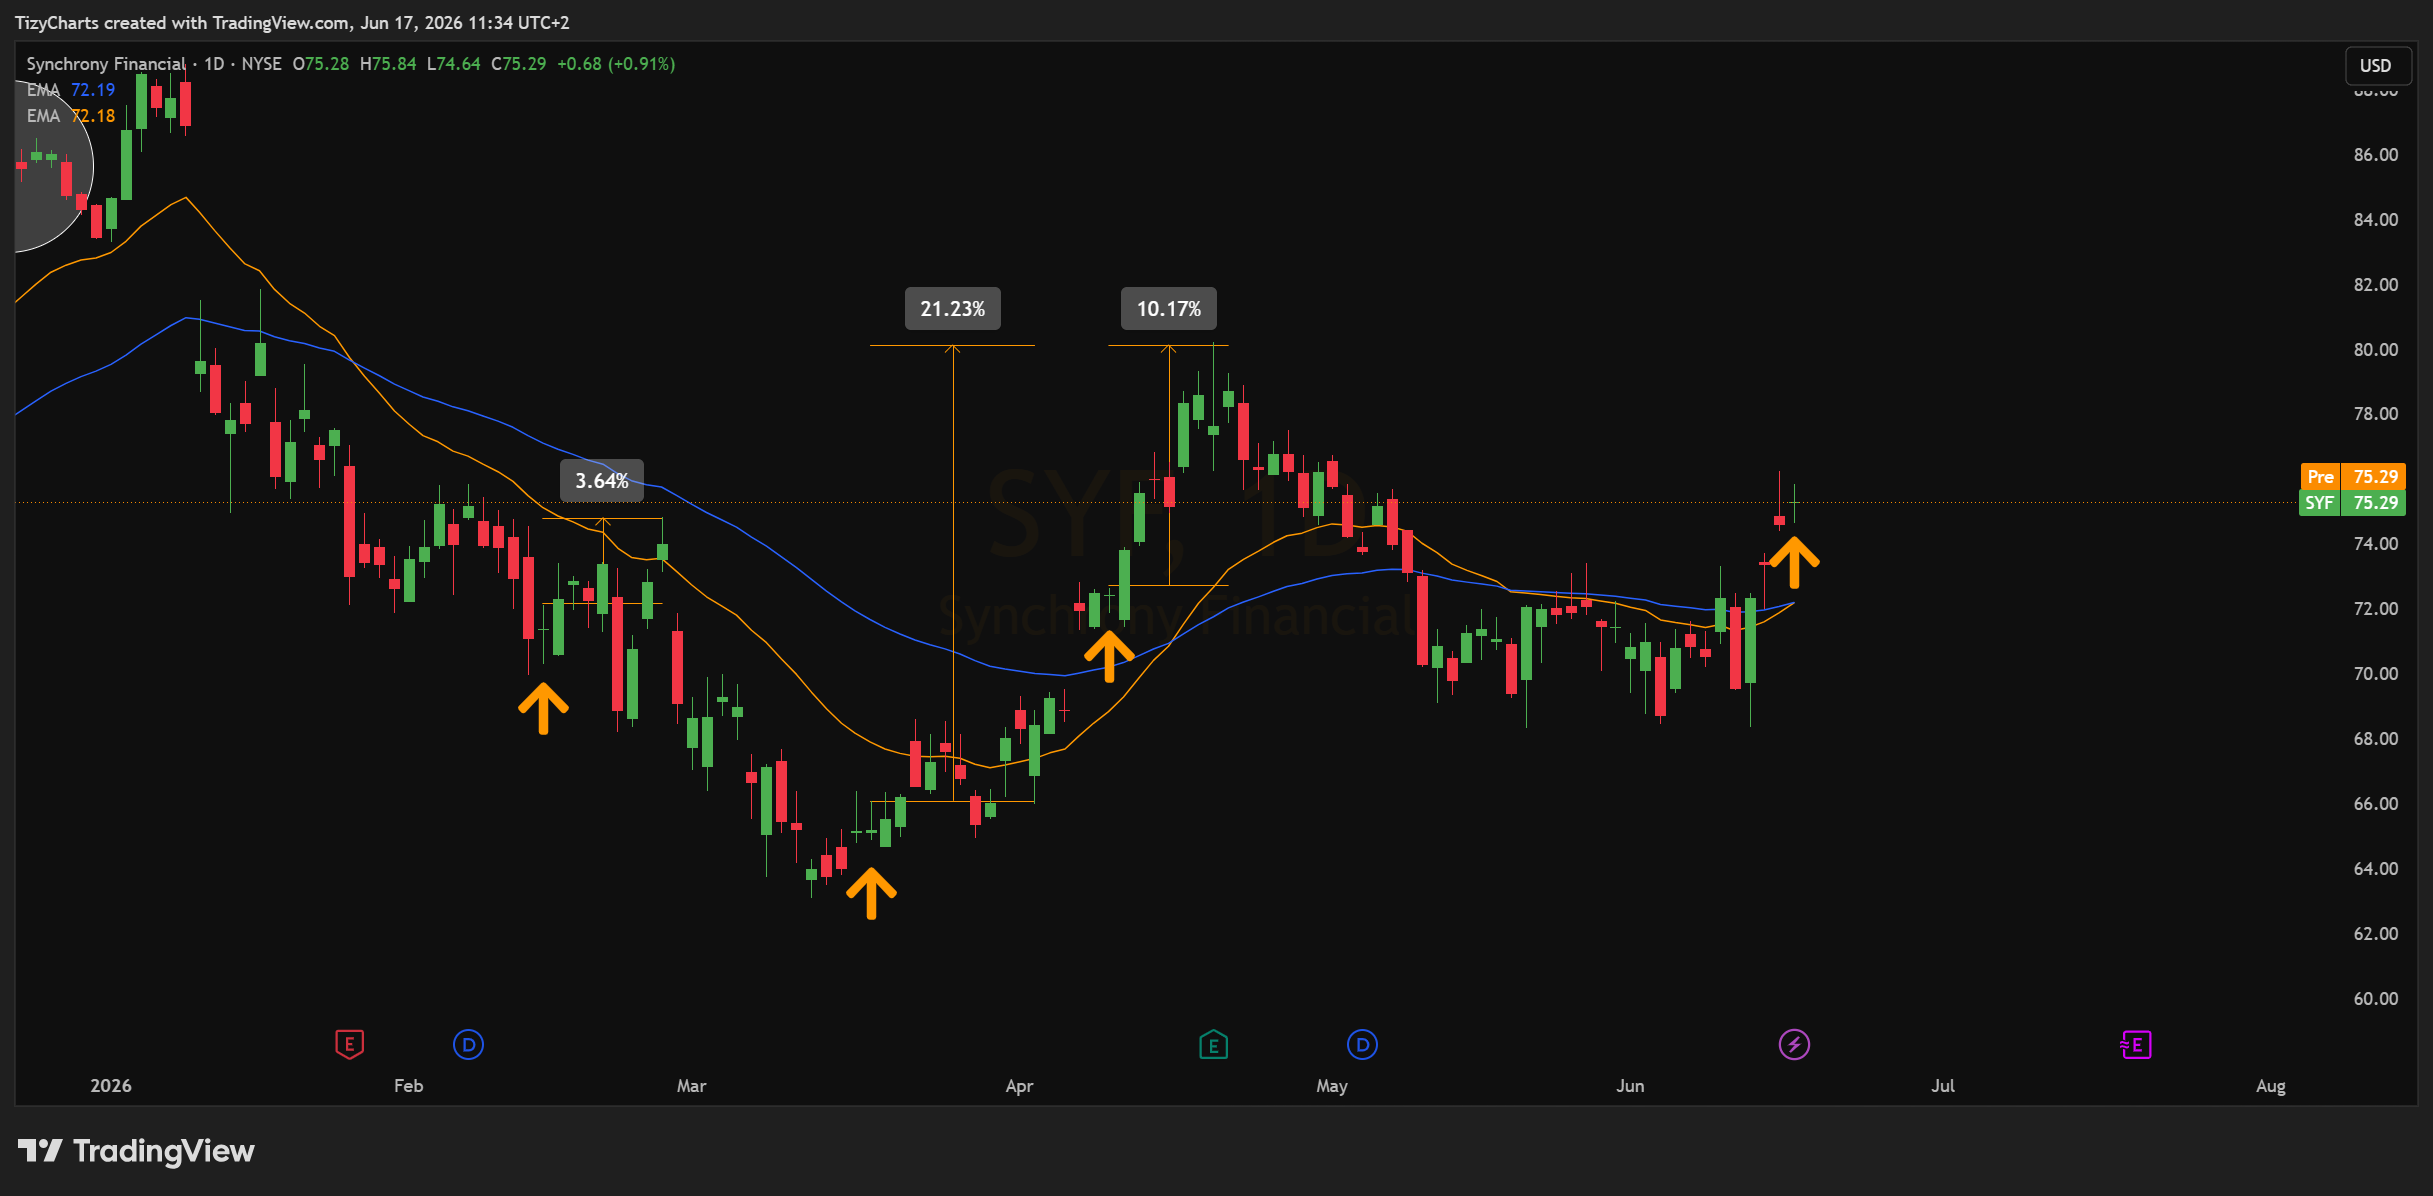
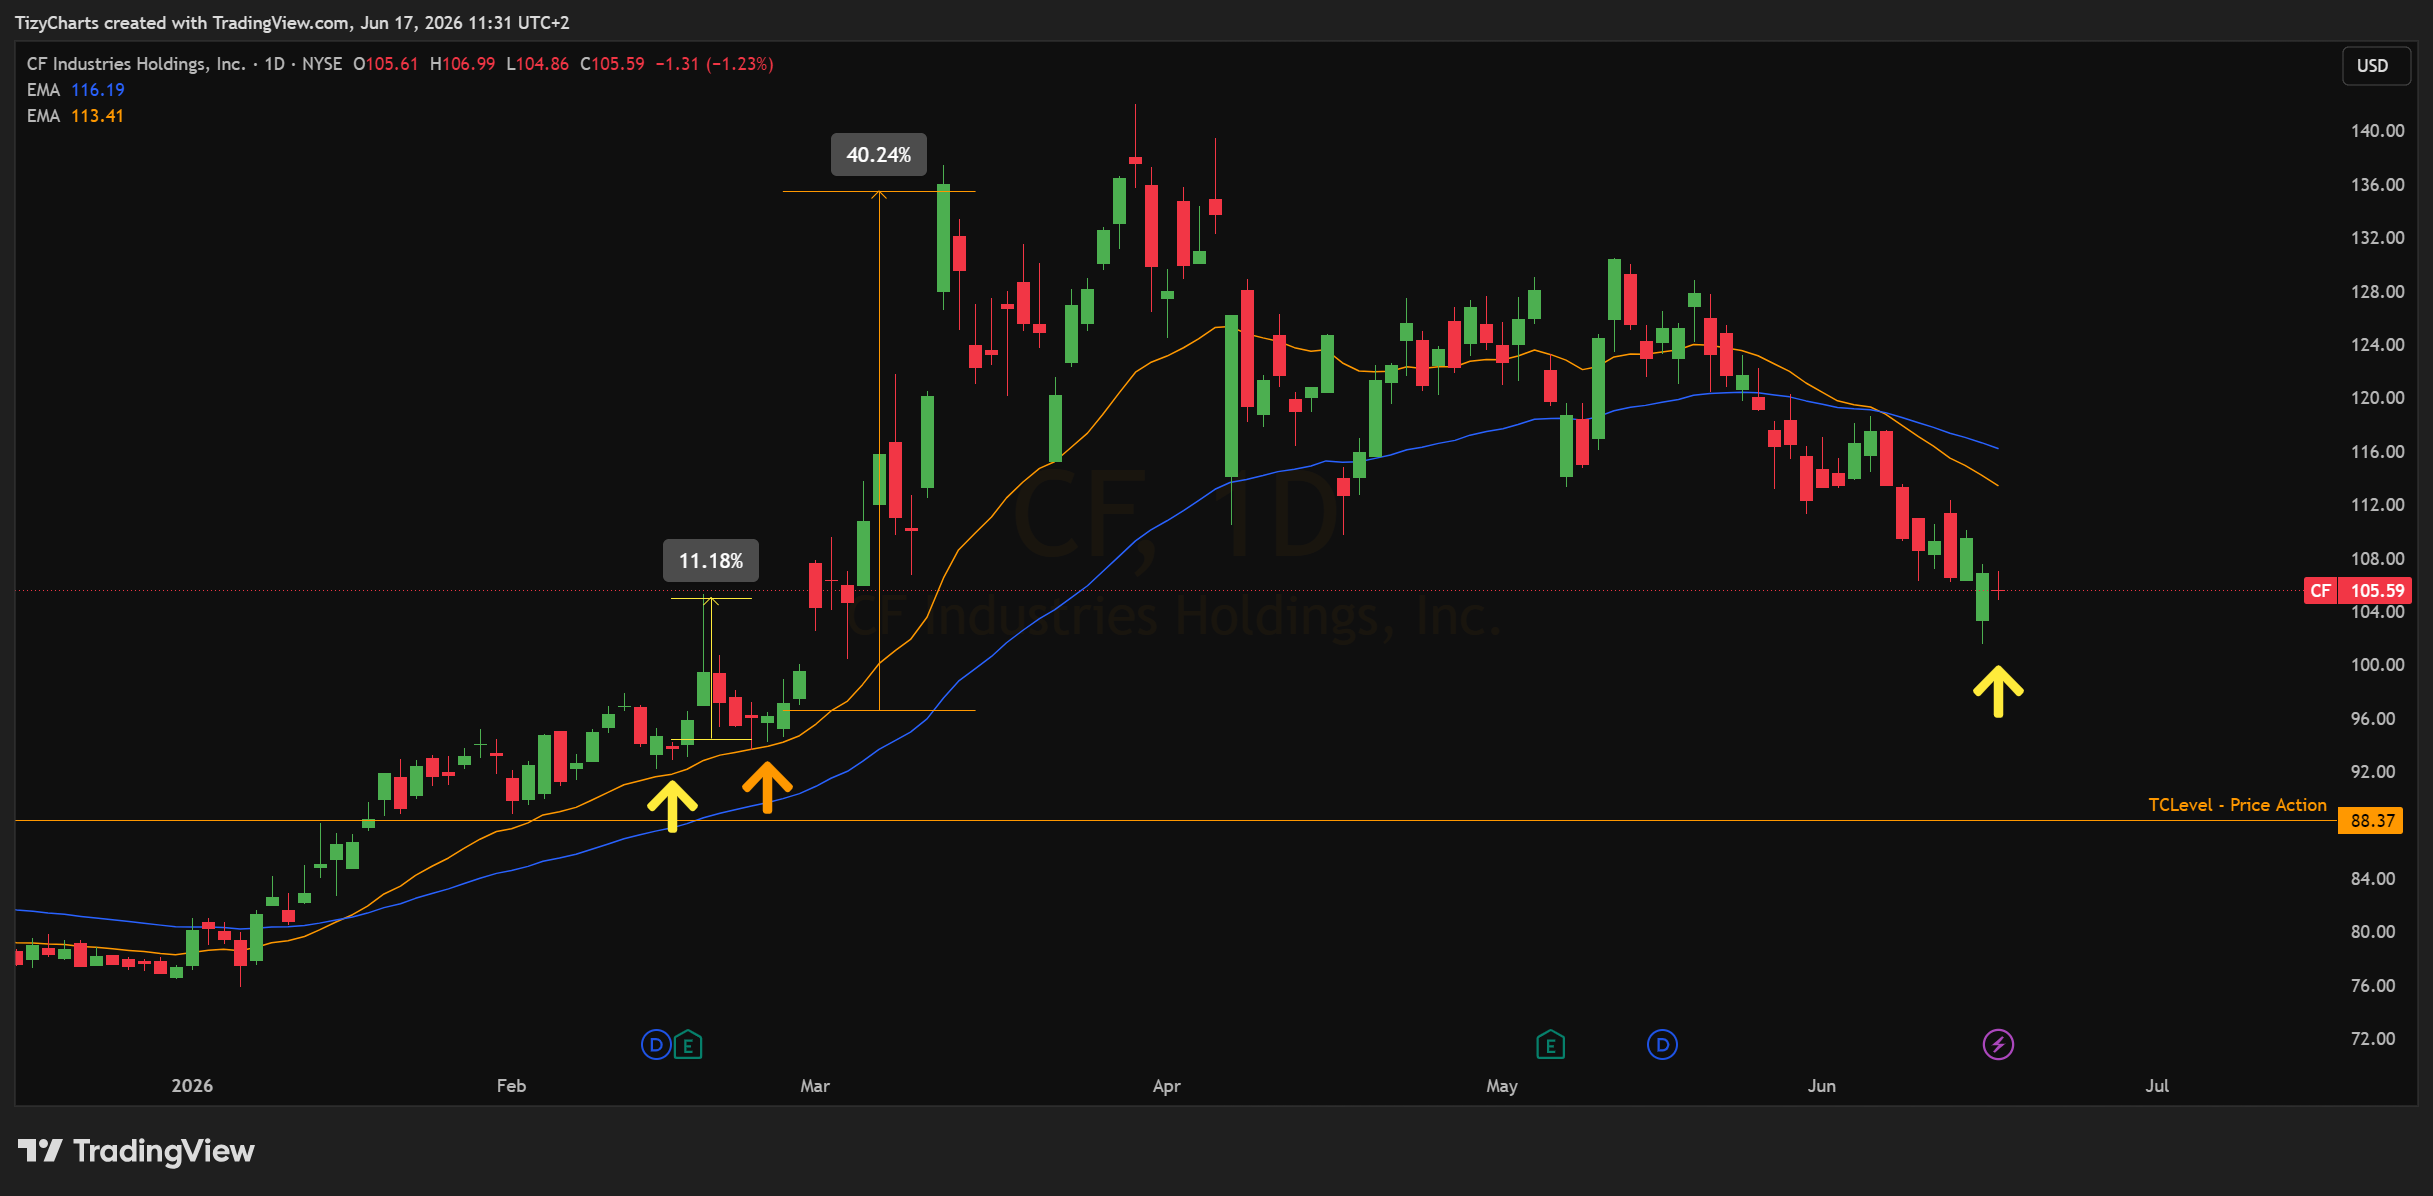
Examples :
Common Mistakes to Avoid
- Trading before the breakout occurs
- Using Dojis that are not fully contained within the previous day’s range
- Ignoring the direction of the reference candle
- Applying the setup during extremely choppy market conditions
- Assuming every breakout will lead to a trend
The setup seeks opportunity, not certainty.
Best Market Conditions
The Doji Inside Strategy tends to attract attention when:
- The broader market is trending
- Momentum stocks are active
- Sector leadership is clear
- Volatility has recently contracted
- Institutional participation is visible
It generally becomes less reliable during prolonged sideways environments where breakouts frequently fail.
Why Traders Watch This Pattern
Markets rarely move in a straight line.
Strong moves are often followed by hesitation.
The Doji Inside pattern attempts to capture that exact moment: the transition between uncertainty and decision.
Most traders focus on the large candle.
Experienced traders often focus on what happens immediately after it.
Sometimes the quietest candle on the chart becomes the most important one.
Strategy Type and Tag
Category: Price Action Continuation Strategy
Tag: Doji Inside Strategy
This pattern is commonly monitored by traders looking for volatility compression, directional continuation, and clean risk definition following a period of temporary market indecision.